
Reports
Group by forty things. Five of them at once.
A tracker earns its place in the twenty seconds it takes to answer one question: which part of this campaign is losing money? That means grouping by the thing you suspect, then by the thing inside it, without exporting anything or writing SQL.
What you can group by
The list is the argument.
Every one of these is a column you can group by, sort on and filter to. They are resolved on the click path, so they are there from the first visitor rather than from the day you think to ask.
What you bought
- Campaign
- Traffic source
- Path
- Landing page
- Offer
- Lander slot
Where they came from
- Country
- Region
- City
- Language
- ISP
- ASN
- Referrer
What they were using
- Device type
- Device brand
- Operating system
- OS version
- Browser
- Browser version
- Connection type
- Mobile operator
What the network told you
- sub1 to sub10
- IP address
How it arrived, and whether it was real
- Arrival kind
- Bot reason
- Proxy kind
When
- Date
- Hour
- Hour of day
- Day of week
- Month
Five levels
The answer is usually two levels down.
A campaign that looks fine at the top is often one country, one zone or one device losing the money the rest is making. Open the row rather than building a new report.
Each level can be any of the forty fields, and the figures recalculate at every level, from the same formulas, so a total and its parts cannot disagree.
An example
- Campaign — ROI 18%
- Country — US 41%, BR −62%
- Zone — 4418260 took 62% of BR
- Device — all of it on one phone model
Four levels, one report, no export. The fifth is there if you need it.
- Clicks
- Unique clicks
- Repeat clicks
- Unique rate
- Lander clicks
- Lander CTR
- Bots
- Bot rate
- Proxy clicks
- Conversions
- Pending
- Rejected
- Total conversions
- Approval rate
- Conversion rate
- Unique conversion rate
- Average payout
- Cost
- Revenue
- Pending revenue
- Rejected revenue
- Profit
- Profit per click
- ROI
- ROI with pending
- ROAS
- CPA
- CPC
- EPC
- EPC on unique clicks
Conversions are counted three ways, because a network that has not paid you yet is not revenue: approved, pending and rejected are separate everywhere, and only approved counts as money.
When, not just where
Which hours actually pay.
The same figures grouped by time rather than by place: months, days, days of the week, and hours of the day. A campaign that breaks even across the week is often profitable for sixteen hours of it and paying for the other eight.
Months
The long view, for anything seasonal.
Days
The default, and the one most decisions are made on.
Days of the week
Every Monday added up, against every Saturday.
Hours of the day
All your 3am traffic in one row, whatever the date.
The logs
When a total is not enough.
A report tells you something is wrong. These tell you which click, which address and which minute — which is what a network asks for when you dispute an invoice.
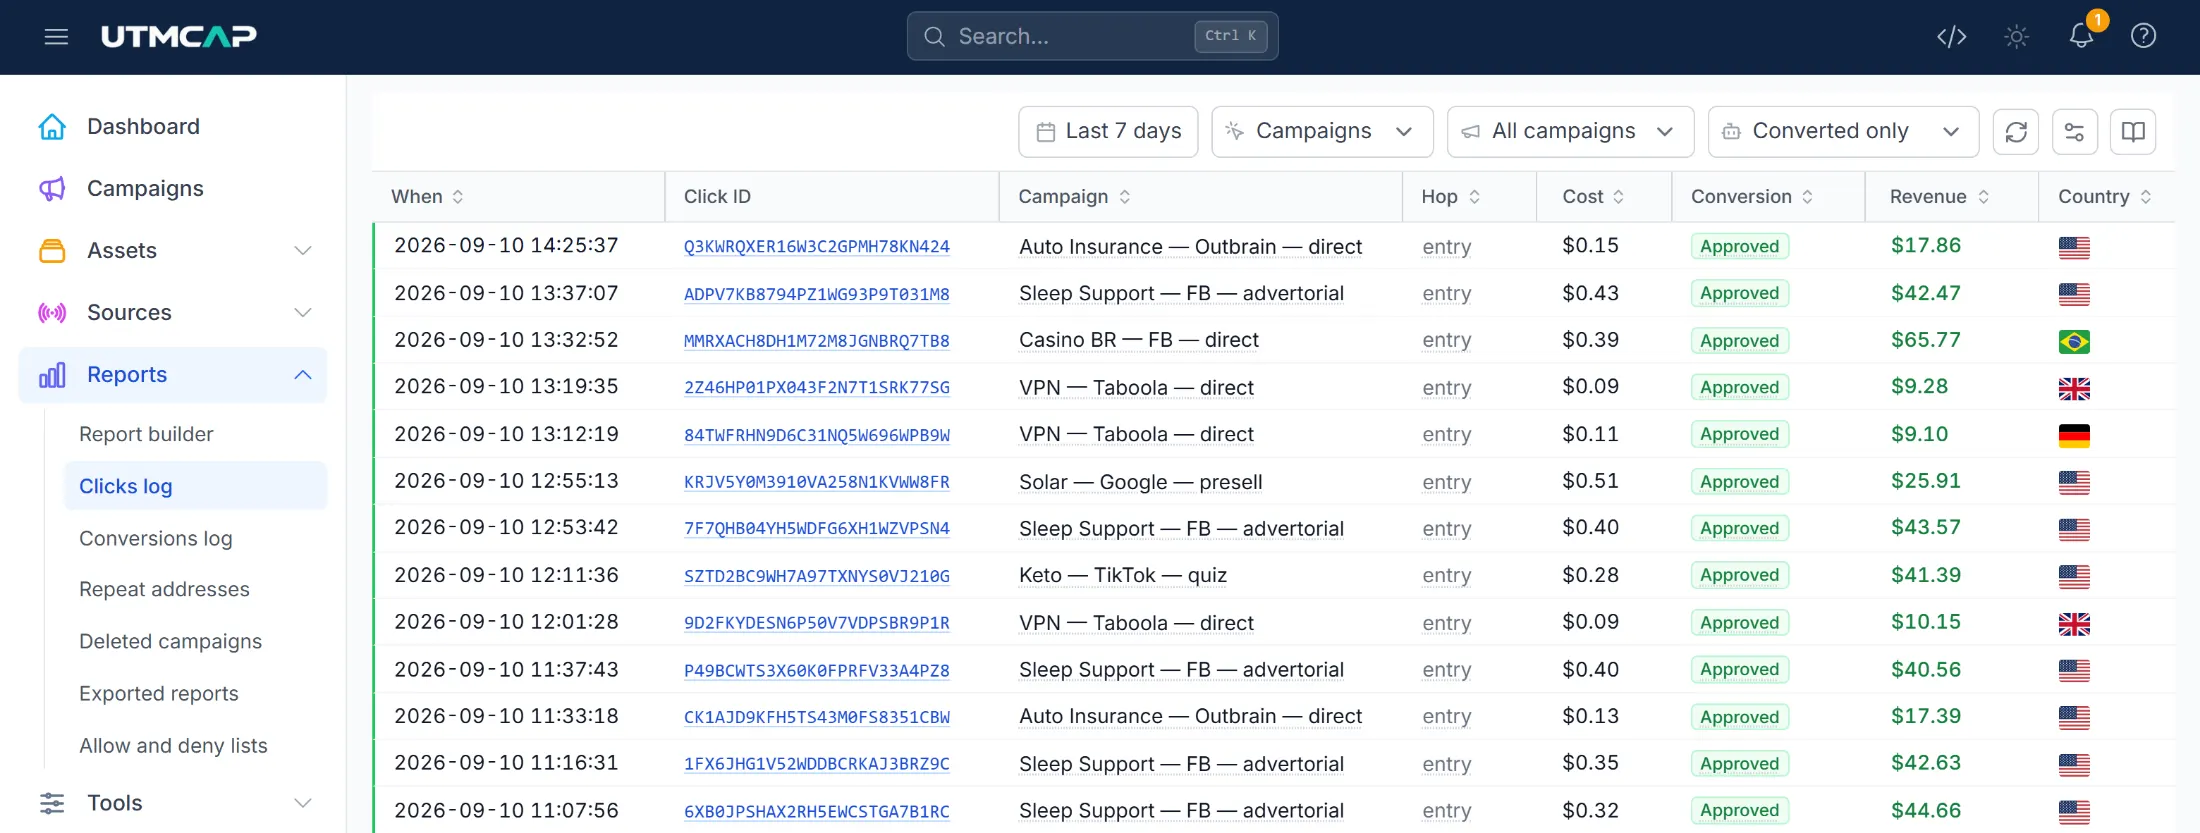
Clicks log
Every click as it was recorded: when, from where, on what, which offer it was sent to, what it cost, and whether a conversion came back.
Conversions log
Every conversion with the click it belongs to, its status, its payout, and the time the network sent it rather than the time it happened.
Repeat addresses
The addresses clicking more than once, and how often. The quickest way to see a network sending you the same visitor all afternoon.
Leftover clicks
Clicks whose campaign no longer exists. Money you spent that would otherwise vanish from every report, kept so the totals still reconcile.
Allow and deny lists
What is being blocked before scoring even starts, with the note somebody wrote when they added it.
Exported reports
Every export you have asked for, with its row count, ready to download. Built on the server, so a large report does not die with the tab.
Questions
The ones that come up.
- How far back can I look?
- As far as your plan keeps clicks: 90 days on the free plan, 12 months on Starter and Growth, 18 on Pro and 24 on Scale. Past that a click is anonymised rather than deleted — the row and its figures stay, so old reports do not empty and a late conversion still finds its click.
- Can I get the data out?
- Yes. Any report exports to CSV, built on the server and waiting for you under exported reports, and the same figures are on the API from the Growth plan up. There is no PDF or Excel export, which is a deliberate omission rather than an oversight: a spreadsheet opens a CSV and a PDF is a picture of numbers.
- Are bots in the figures?
- They are counted, and they are separate. Every report shows bots and a bot rate beside the real clicks, and filtered traffic is left out of cost as well as clicks, so a network sending you rubbish cannot quietly raise your reported CPA.
- What is a leftover click?
- A click whose campaign was deleted afterwards. Most trackers drop it and the money spent disappears with it. We keep it in its own report so what you spent and what your reports say still add up.
- Does a report cost me anything?
- No. Reports, exports and logs are on every plan including the free one, and they are not metered. The only thing priced here is clicks.
Point a domain at us and run a click through it.
The free plan takes a hundred thousand clicks a month and no card. If it does not do what you need, you have lost twenty minutes.